Seismograms around Nuugaatsiaq Greenland landslide image a complex source process lasting about 2 minutes.
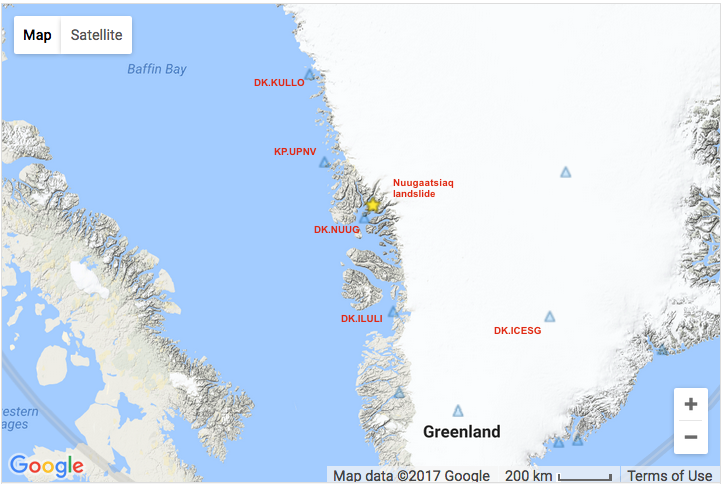
3 component seismograms available from IRIS for stations from about 30 to 500km from the Nuugaatsiaq landslide are shown below. The traces are aligned (vertical red line) on a distinct, ~5sec pulse on the transverse component (magenta traces). Seismic phases from the USGS origin for the landslide (To, P, Lq, Lr) identify this pulse as a Love wave (Lq) from the source.
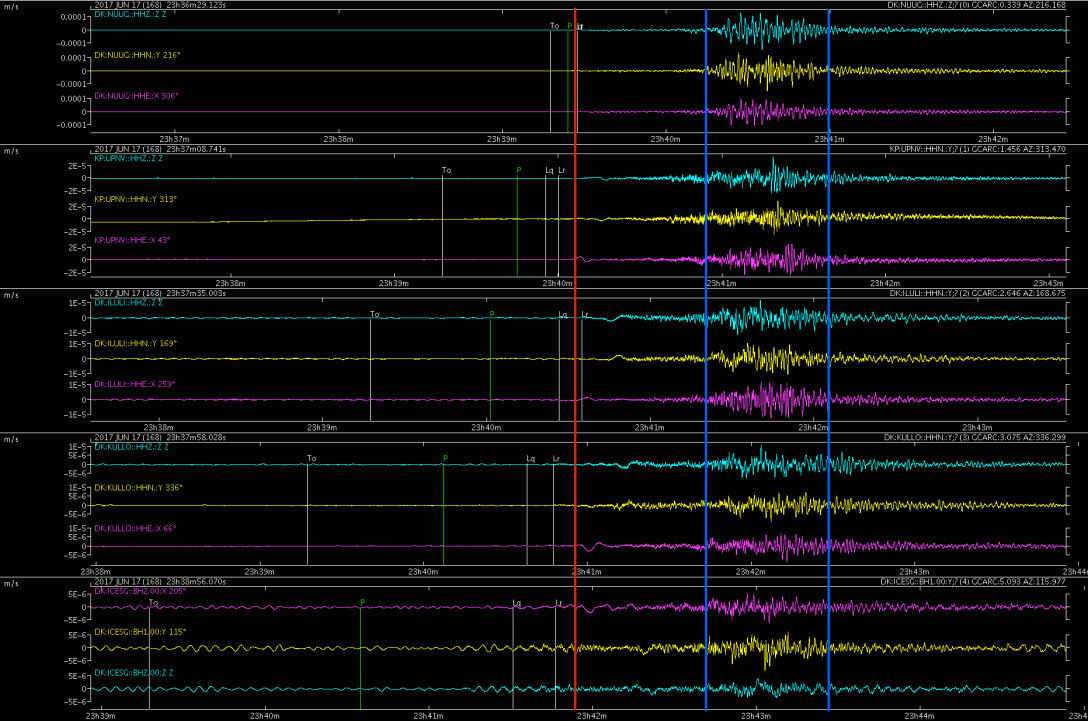
A few seconds after this pulse is a similar pulse on the vertical (cyan) and radial (yellow) traces, this signal can be identified as the Rayleigh wave (Lr) from the source. [The misalignment of the predicted Lq and Lr times with the pulses on the seismograms can be attributed to the ~20km offset of the USGS epicenter to the NNW of the landslide, and to specifics of the Greenland crustal geology.]
What is striking about these seismograms is that, when aligned on the Love wave, the following ~2min on the traces are also well aligned with similar waveforms. All seismograms show about 50sec of low amplitude, higher frequency signal, and then an ~50sec long packet of higher amplitude signal (vertical blue lines). Because the stations are at greatly different distances from the source, these similar signals are not related to the seismic wave propagation from the source to seismographs, but instead can be directly attributed to the source process.
In this case, the Love and Rayleigh wave pulses suggest an initial, strong, relatively smooth source rupture or lurch with a duration of ~5sec or longer, followed immediately by ~50sec of lower energy, higher frequency rupture, and then ~50sec of stronger rupturing with both higher frequencies and long period components. Some explanations for this apparent source process are:
A plot of the same seismograms filtered so that only signals with periods longer than 5sec are visible shows that the the ~50sec of higher amplitude signal (vertical blue lines) begins with a strong, ~10sec period pulses.
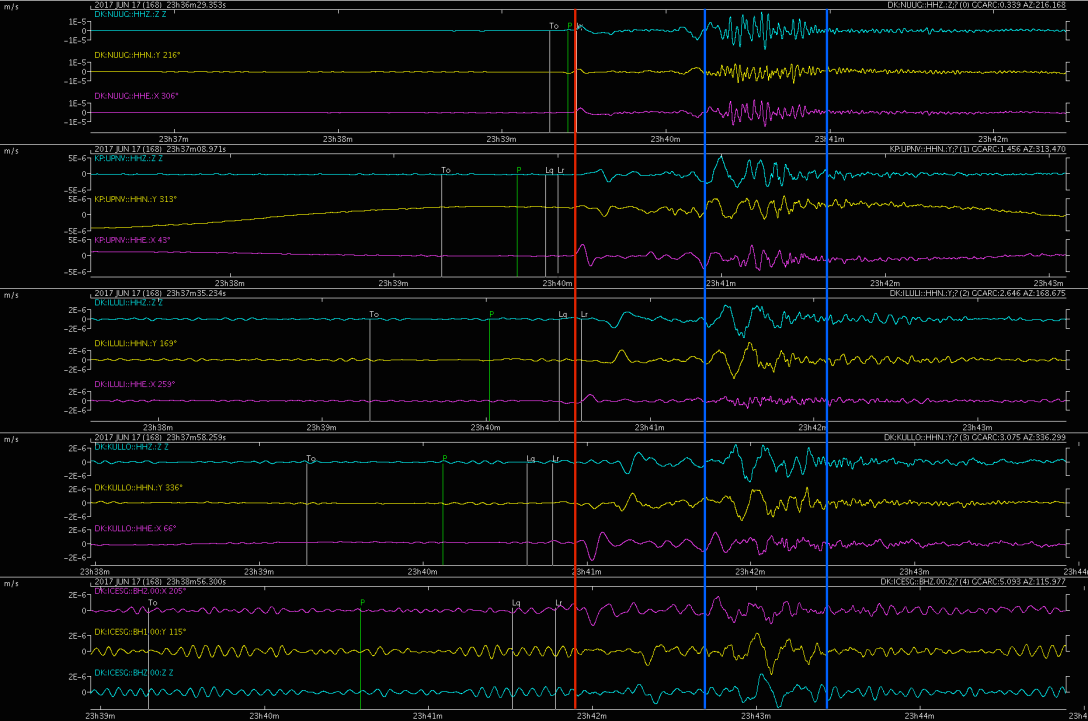
These pulses are strongest on the vertical (cyan) and radial (yellow) traces, thus are mainly Rayleigh waves. Stronger Rayleigh waves for this later rupture relative to the stronger Love waves for the initial pulse would imply that these two rupture pulses have different source mechanisms or slip plane orientations.
There may also have been additional, slow, smooth landsliding between the initial and later large pulses; such “very long wavelength” source motion might not be captured clearly on the seismograms.
Sources:
https://earthquake.usgs.gov/earthquakes/eventpage/us20009nlg#executive
http://ds.iris.edu/wilber3/find_event

One thought on “Nuugaatsiaq Greenland landslide and tsunami: Seismograms suggest several stages of land failure”